“K-shaped” describes an economy where different income groups move in opposite directions instead of together, one group rising and one falling, like the two strokes of the letter K. The term became shorthand during the pandemic recovery, when markets and white-collar pay bounced back quickly while lower-wage workers kept struggling.
The Financial Health Pulse 2026 U.S. Trends Report asks directly whether the U.S. economy is K-shaped right now, and its answer is careful. Spending and income grew faster for higher-income households in 2025 and 2026, while lower-income households absorbed higher inflation. But only the low-income group's year-over-year changes were large enough to be statistically confident about, so the report stops short of confirming a K-shaped trend and calls it, instead, an early pattern of divergence worth watching.
Two of the report's core financial health indicators break out by income group, and both point the same direction.
Low-income households cut back on saving. Every other group held roughly steady.
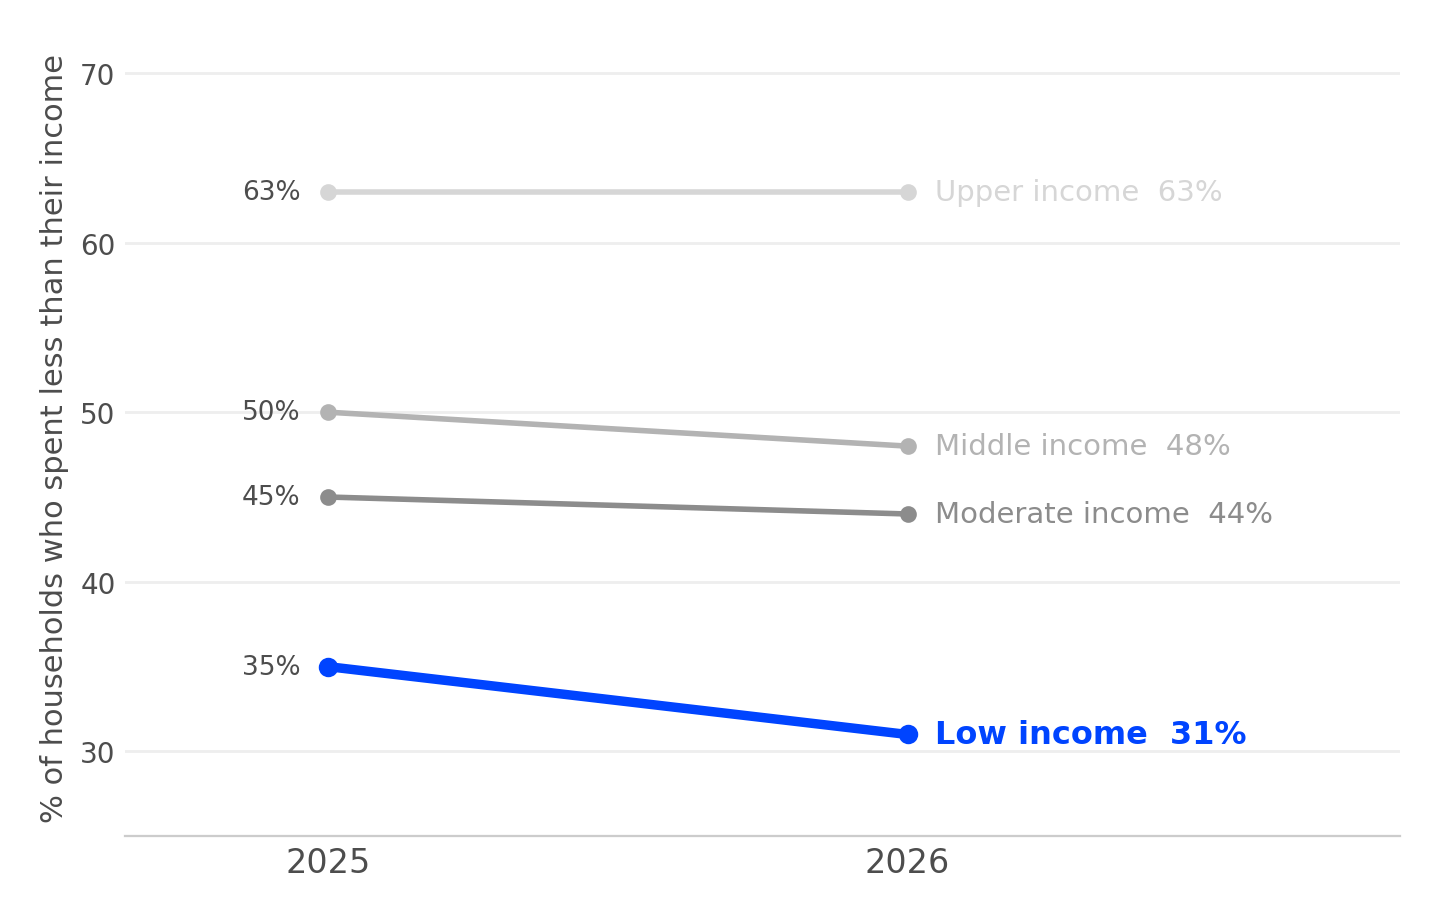
Share of households who spent less than their income over the prior 12 months, by income group. Source: Financial Health Network, Financial Health Pulse 2026 U.S. Trends Report. n = 639–2,846 depending on income group and year.
Low-income households were also less likely to pay every bill on time, and the gap moved in the opposite direction for at least one other group.
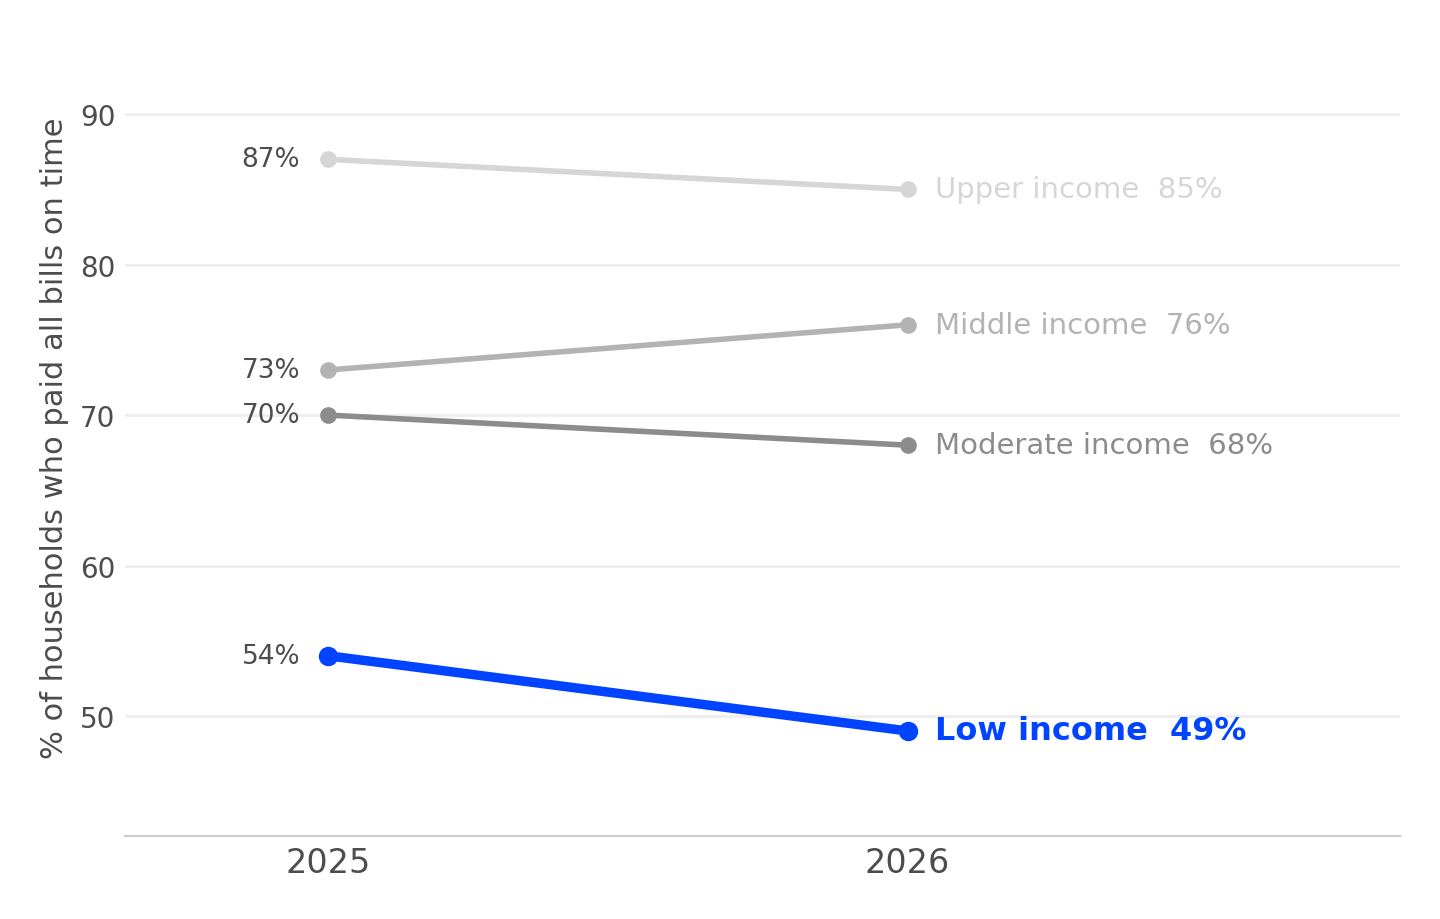
Share of households who paid all their bills on time over the prior 12 months, by income group. Source: Financial Health Network, Financial Health Pulse 2026 U.S. Trends Report. n = 639–2,846 depending on income group and year.
Households under 50% of their area's median income went from 35% to 31% on spending less than their income, and from 54% to 49% on paying every bill on time, both statistically significant declines. Moderate- and middle-income households barely moved, and upper-income households were essentially flat. That's exactly why the report hedges rather than declaring a confirmed trend. The one group with a real, measurable decline is also the group with the least room to absorb it.
The report's headline number, 31% of households Financially Healthy, hasn't moved in five years. That stability is deceptive. Using a subset of households tracked in both the 2025 and 2026 surveys, the report finds that 30.3 million households, 23% of the nation, moved either up or down a financial health tier in a single year. Movement down was more common than movement up: 16.5 million households slid a tier while 13.8 million climbed one. About 7.8 million households who were Financially Coping in 2025 became Financially Vulnerable in 2026, while roughly 6.0 million moved the other way, for a net gain of 1.8 million Vulnerable households.
A flat national average can sit on top of a lot of churn, and that churn isn't distributed evenly. It concentrates in the same lower-income households the K-shaped data flags as falling behind.
The same pattern plays out inside one workforce, not just across the country. A company's average employee sentiment or financial wellness numbers can look steady while a specific segment, usually hourly or lower-wage staff, is quietly sliding on the exact same measures: less able to save, more likely to miss a bill, more likely to describe their debt as unmanageable. If a benefits program is built around the salaried majority, or reports success at the company average, it can miss the group actually losing ground.
Rain's AI Financial Health Agent is built for exactly this segment. It works continuously in the background, combining an employer's payroll data with an employee's own financial activity to catch a cash flow gap before it turns into a missed bill or an overdraft fee, rather than waiting for an employee to go looking for help. Paired with earned wage access and a Rainy Day savings fund, it addresses the two indicators this report shows are already declining for lower-income households: the ability to save and the ability to pay bills on time.
Rain's own users report a 78% drop in financial stress and save roughly $600 a year they'd otherwise lose to overdrafts and payday loans. Employers see 35% lower turnover and twice the applicant volume on roles offering Rain, at zero added cost or payroll disruption.
Source: Rain Business Impact data, rainapp.com/outcomes
Rain doesn't reverse a K-shaped economy. No single employer benefit can. But the report's own caution cuts both ways: the fact that a wider national trend isn't yet statistically confirmed doesn't mean the pattern isn't already visible in a company's own attendance, turnover and exit-interview data. The question worth asking isn't whether the whole economy has split. It's whether a piece of your own workforce already has, and whether your benefits stack was built to catch it.
© 2026 Rain Technologies Inc.